Onboard Data API Bindings documentation

This package provides Python and R bindings to Onboard Data’s building data API, allowing easy and lightweight access to building data.
For example, we can retrieve the last week of temperature data from all Zone Temperature points associated with FCUs in the Laboratory building:
import pandas as pd
from onboard.client import OnboardClient
from onboard.client.dataframes import points_df_from_streaming_timeseries
from onboard.client.models import PointSelector, TimeseriesQuery, PointData
from datetime import datetime, timezone, timedelta
from typing import List
import pytz
client = OnboardClient(api_key='your-api-key-here')

print(list(pd.DataFrame(client.get_all_buildings())['name'])) # returns list of buildings that you have access to (you may not have 'Laboratory' in your set)

query = PointSelector()
query.point_types     = ['zone_air_temperature_sensor'] # can list multiple point types,
query.equipment_types = ['HVAC/FCU']                    # equipment types,
query.buildings       = ['Laboratory']                  # buildings, etc.
selection = client.select_points(query)

start = pd.Timestamp("2022-03-29 00:00:00", tz="utc")
end = pd.Timestamp("2022-07-29 00:00:00", tz="utc")

timeseries_query = TimeseriesQuery(point_ids = selection['points'], start = start, end = end)
sensor_data = points_df_from_streaming_timeseries(client.stream_point_timeseries(timeseries_query))
install.packages(c('OnboardClient', 'lubridate'))           # install whatever libraries you don't already have
library(OnboardClient)
library(lubridate)                                          # for datetime handling

api.setup()                                                 # will prompt for api key
query <- PointSelector()                                    # create point selector
query$point_types       <- c('zone_air_temperature_sensor') # can list multiple point types
query$equipment_types   <- c('HVAC/FCU')                    # equipment types,
query$buildings         <- c('Laboratory')                  # buildings, etc.
selection <- select_points(query)

start <- as_datetime("2022-03-29 00:00:00", tz = "UTC")
end <- as_datetime("2022-07-29 00:00:00", tz = "UTC")

sensor_data <- get_timeseries(start_time = start, end_time = end, point_ids = selection$points) #Queries timeseries data for the selection list we got above
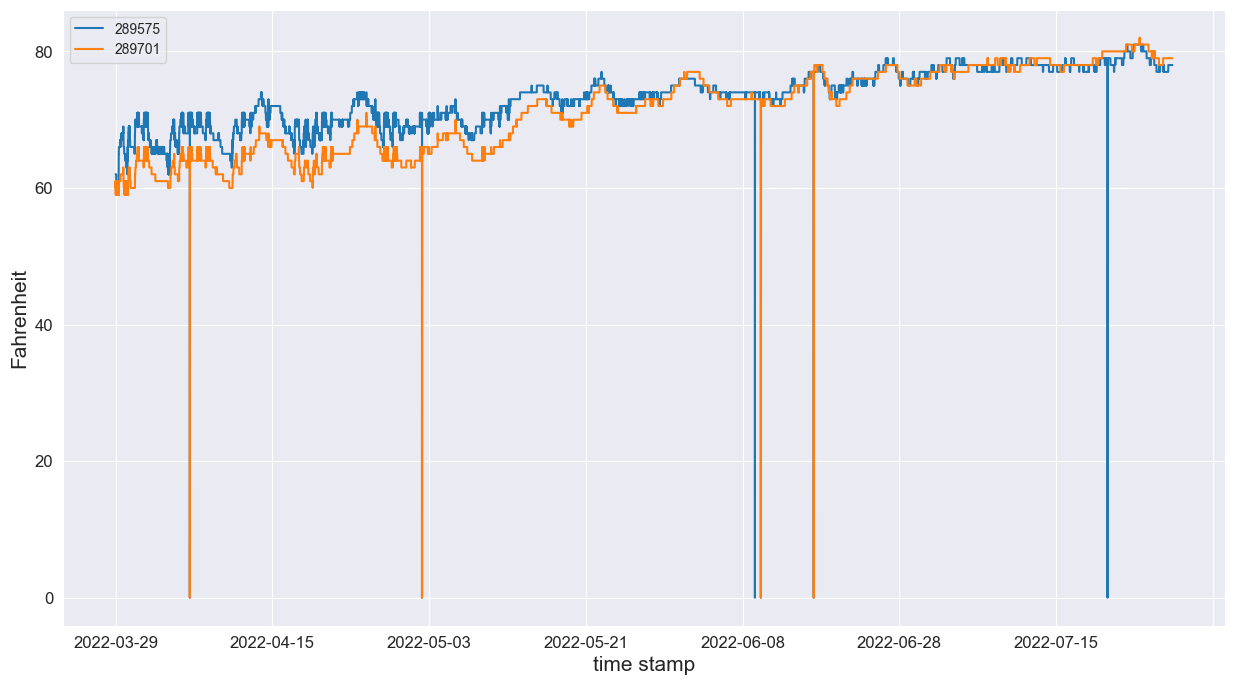
and to plot:
import matplotlib.pyplot as plt
import numpy as np
# set the timestamp as the index and forward fill the data for plotting
sensor_data_clean = sensor_data.set_index('timestamp').astype(float).ffill()
# Edit the indexes just for visualization purposes
indexes = [i.split('T')[0] for i in list(sensor_data_clean.index)]
sensor_data_clean.index = indexes
fig = sensor_data_clean.plot(figsize=(15,8), fontsize = 12)
fig.set_ylabel('Fahrenheit',fontdict={'fontsize':15})
fig.set_xlabel('time stamp',fontdict={'fontsize':15})
plt.show()
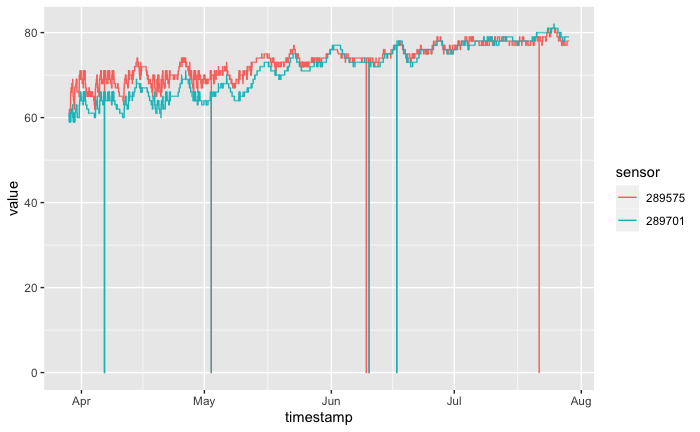
library(tidyverse)

sensor_data_clean <- sensor_data %>%
  mutate(timestamp = floor_date(timestamp, unit = "seconds")) %>%
  pivot_longer(-timestamp, names_to = "sensor", values_to = "value") %>%
  drop_na(value) %>%
  arrange(timestamp)

sensor_data_clean %>%
  ggplot(aes(x = timestamp, y = value, color = sensor)) +
  geom_line()
For installation instructions, and to get set up with API access, refer to Initial Setup.
Note
While we are committed to backwards-compatibility, this project is under active development. If you discover a feature that would be helpful, or any unexpected behavior, please contact us at support@onboarddata.io.
Contents
License
Copyright 2018-2024 Onboard Data Inc
Licensed under the Apache License, Version 2.0 (the “License”); you may not use this file except in compliance with the License. You may obtain a copy of the License at
Unless required by applicable law or agreed to in writing, software distributed under the License is distributed on an “AS IS” BASIS, WITHOUT WARRANTIES OR CONDITIONS OF ANY KIND, either express or implied. See the License for the specific language governing permissions and limitations under the License.